Observability & Tracing
Because AI is inherently non-deterministic, debugging your application without any observability tool is more like guesswork. Well implemented observability gives you the tools to understand what’s happening inside your application and why.
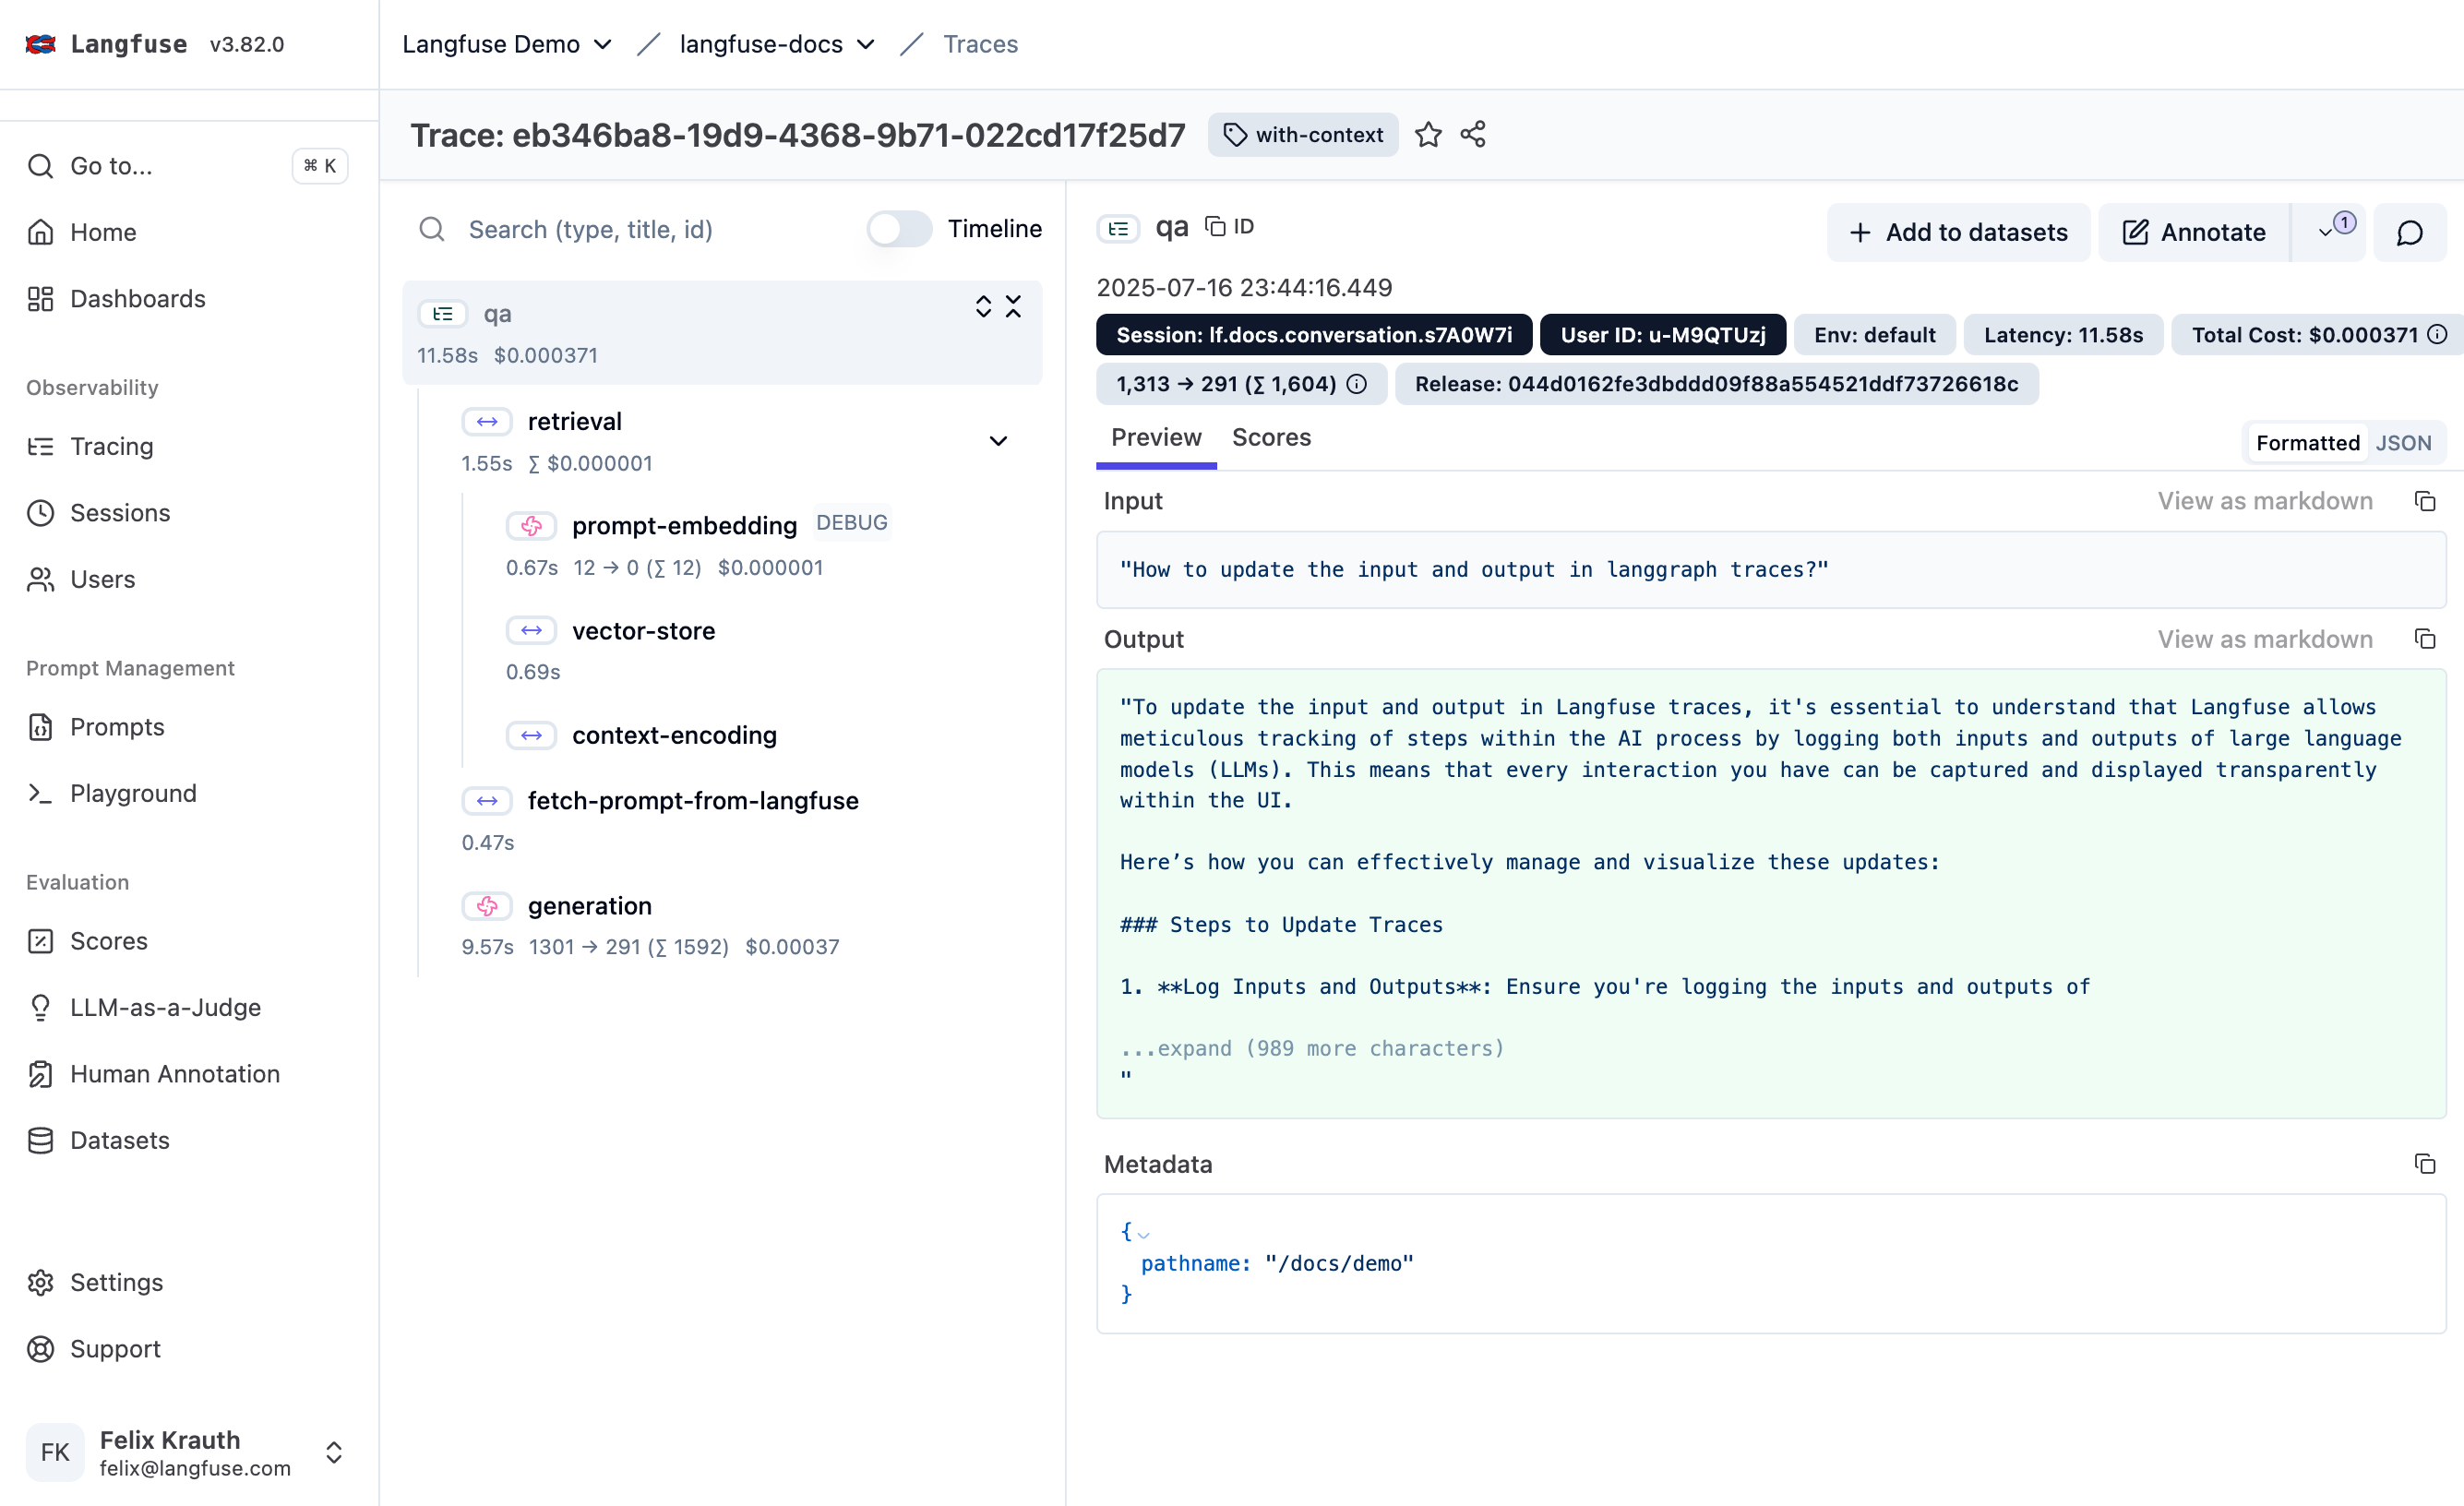
The core of this is tracing. It gives you structured logs of every request: the exact prompt sent, the model’s response, token usage, latency, and any tools or retrieval steps in between.
Langfuse captures all of this for you as you build. Here’s an example of a trace in the Langfuse UI:
Watch this walkthrough of Langfuse Observability and how to integrate it with your application.
Getting started
Start by setting up your first trace.
Take a moment to understand the core concepts of tracing in Langfuse: traces, sessions, and observations.
Once you’re up and running, you can start adding on more functionality to your traces. We recommend starting with the following:
- Group traces into sessions for multi-turn applications
- Split traces into environments for different stages of your application
- Add attributes to your traces so you can filter them in the future
Already know what you want? Take a look under Features for guides on specific topics.